Case study · Integrated campaign · NFL · 2025
Four NFL-posted stories accounted for 98.1% of organic views
I ran the publishing plan and produced the post-campaign analysis for Stand Together’s 2025 My Cause My Cleats program. Its 14.1M organic views were concentrated in four stories the NFL posted. That pattern informed my recommendation to consider likely league and team interest earlier in planning.
In brief
- Role
- Ran the master publishing plan across five channel types; wrote and adapted the copy; designed the reusable package; tracked tags, live links, and partner responses; built the post-campaign analysis.
- Key decisions
- Reusable story packages, a shared view of partner activity, and an analysis that compared publishing outcomes across the program.
- Selected result
- 14,128,013 organic views and 336,648 engagements across 63 placements, a team campaign result. Four NFL-posted stories accounted for 98.1% of views.
The copy itself
For the Jonathan Allen story, I put his experience in foster care ahead of the partner name. These are the headline options I wrote for the YouTube release with CarePortal, which connects families’ needs to help from their communities:
Jonathan Allen lived in foster care. Here’s how he’s backing foster families | My Cause My Cleats
Jonathan Allen grew up in foster care. Now he’s joined the fight to keep families together | My Cause My Cleats
Why Jonathan Allen backs this community-powered tool keeping families together | My Cause My Cleats
Authored copy from the published campaign package: player’s lived stake first, cause mechanism second, brand nowhere in the headline. The full package carried thumbnail text, platform descriptions, and per-network adaptations built on the same template.
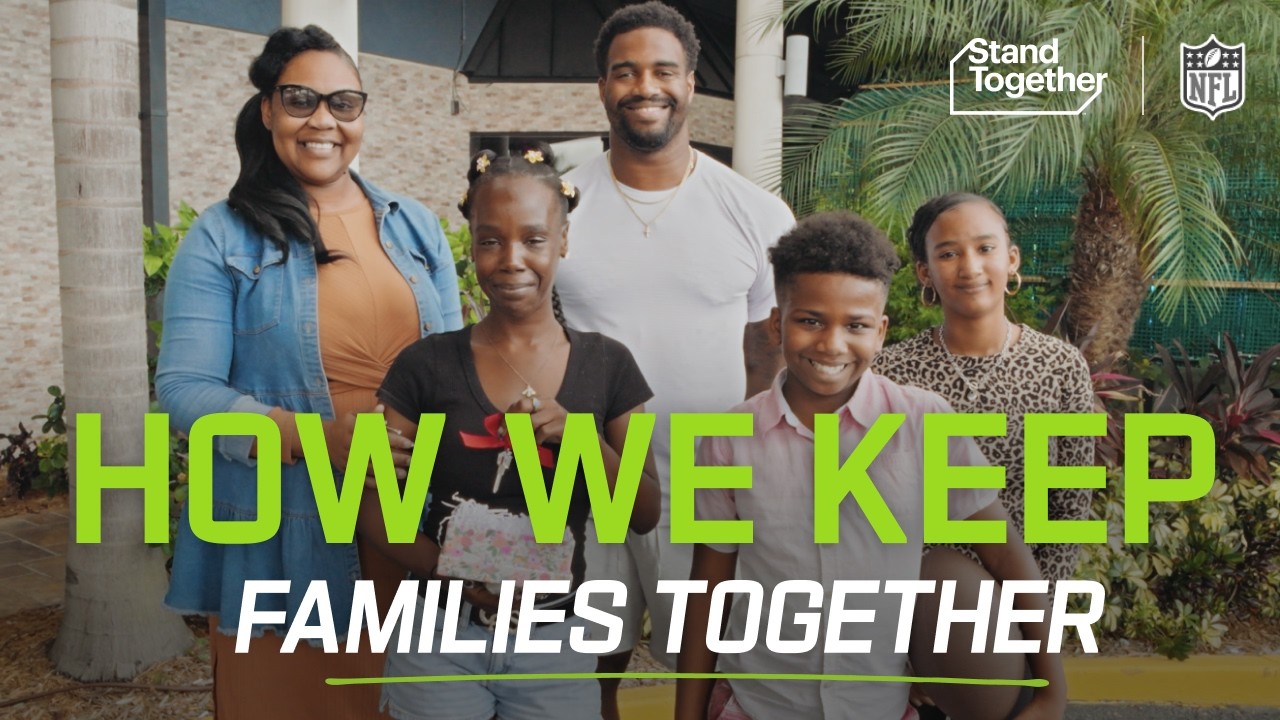 Why Jonathan Allen backs this community-powered tool keeping families together | My Cause My Cleats
The campaign, the problem
My Cause My Cleats is the NFL’s annual cause campaign. Stand Together and Freethink produced stories about players and the causes they back. Each release moved through league, team, player, nonprofit, and brand channels on different schedules and approval chains. The organic export tracks 12 named-player stories plus an Origins record.
My role
I ran the master publishing plan, wrote and adapted copy, designed the reusable package, and tracked tags, live links, and partner responses. I also produced the post-campaign analysis. Film production, partnership ownership, and paid media sat elsewhere on the team.
- League and team cutdown channels
- 14,100,383 views · 99.8% of the organic program
- Stand Together channels
- 27,630 views · 0.2% of the organic program
Three decisions that mattered
- One reusable packaging template. Headline options, platform copy, thumbnail direction, descriptions, and hashtags gave each release a common structure, with the angle adapted to the story.
- Sequencing weighted toward the channels most likely to seed reach, with follow-up pushes for channels that hadn’t activated within the expected window, visible because activation was tracked in one place.
- Compare publishing outcomes. I grouped the export by whether the NFL or a team posted each story, then checked how views were distributed across those groups.
Where the views were recorded
The organic program recorded 14,128,013 views and 336,648 engagements across 63 placements. Four stories posted by the NFL accounted for 13,866,526 views, or 98.1%. Two team-only stories accounted for 260,603 views. The remaining seven tracked records accounted for 884 views, including an Origins record not intended for brand posting.
| Who posted the cutdown | Records | Organic views | Share |
|---|---|---|---|
| The NFL | 4 | 13,866,526 | 98.1% |
| A team, but not the league | 2 | 260,603 | 1.8% |
| Neither (includes Origins) | 7 | 884 | 0.006% |
What the analysis could not settle
This was a comparison of observed publishing outcomes. It did not isolate creative quality, player profile, timing, exposure duration, or the decisions behind league selection. A common packaging template did not control those differences.
What changed next
I recommended considering league and team interest before production, putting more packaging effort behind likely pickups, and building a fallback distribution plan for the others. The concentration gave that planning conversation a concrete starting point.
This is the campaign-scale version of a question that comes up every week: who else has to participate for this story to reach its audience, and what do they need from us? The article-to-social process applies that question to everyday editorial work, where the partner might be a small nonprofit rather than a league.
Before this: the 2024 cycle
The previous year, I had seen the same pattern across only three stories. Rachaad White posted and pinned his cutdown, the Buccaneers reshared it, and separate partner posts drew 192,900 views. Demario Davis’s story reached 515,900 through separate posts after the NFL picked it up. The Steelers liked Miles Killebrew’s Instagram post and uploaded nothing, leaving his separate-post count at zero. The 2025 export offered a larger descriptive comparison, with the same limits on causal interpretation. Read the full 2024 case →